 |
Arktis Hoher Norden |
|
Arktis Weitere Informationen |
|
|
Klimaforschung
in der Arktis
|
 |
|
Geringe Eisausdehnung im Arktischen Meer
|
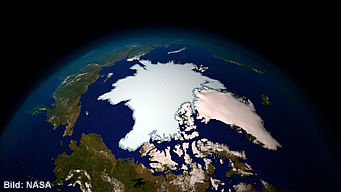 |
| Die minimale Eisfläche um den Nordpol war im Sommer 2009 etwas grösser als im Sommer 2008. Die Eisausdehnung im arktischen Sommer erreichte allerdings einen der geringsten Werte seit Beginn der Aufzeichnungen im Jahr 1979. Nur in den Jahren 2008 und 2007 war die Eisfläche auf dem Arktischen Meer im Sommer noch geringer als 2009. |
|
Gemäss Angaben des US National Snow and Ice Data Centers betrug die minimale Ausdehnung der arktischen Eisfläche 2009 noch rund 5,1 Millionen Quadratkilometer. Der durchschnittliche Minimalwert des Meereisfläche im arktischen Meer betrug von 1979 bis 2000 rund 6,71 Millionen Quadratkilometer. Forscher haben zudem festgestellt, dass sich die Eisdicke und die Eiskonzentration trotz der leichten Zunahme der Eisfläche im Jahr 2009 gegenüber 2008 nicht verändert haben. Die Zunahme der minimalen Eisfläche im Sommer 2009 war auf die durch starke Winde gebrochenen Eisflächen zurückzuführen.
|
| Quelle: NOAA, August 2009 |
|
Rekordwassertemperaturen in den Weltmeeren
|
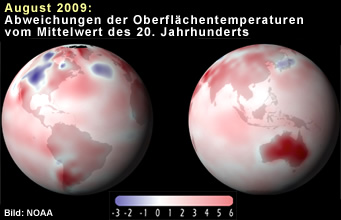 |
NOAA: Wärmerekord für die Meeresoberflächen im Juli 2009
 Die Oberflächentemperaturen der Weltmeeren erreichten im Juli 2009 einen neuen Höchstwert. Das National Climatic Data Center der US Wetterbehörde NOAA mass eine um 1,06°C höhere Wassertemperatur als die Durchschnitttemperatur von 16,4°C im letzten Jahrhundert. Der neue Rekordwert löst den Wert aus dem Jahr 1998 ab. Die Oberflächentemperaturen der Weltmeeren erreichten im Juli 2009 einen neuen Höchstwert. Das National Climatic Data Center der US Wetterbehörde NOAA mass eine um 1,06°C höhere Wassertemperatur als die Durchschnitttemperatur von 16,4°C im letzten Jahrhundert. Der neue Rekordwert löst den Wert aus dem Jahr 1998 ab.
|
|
Der weltweite Durschnittstemperatur für die Land- und Wassemassen betrug im Juli 2009 15,8° C und war damit um 0,57°C höher als der Mitteltwert im 20. Jahrhundert. Seit Messbeginn im Jahr 1980 wurden erst vier höhere Temperaturmittelwerte gemessen.
Der weltweite Durschnittstemperatur für die Landmassen betrug im Juli 2009 14,2° C und war damit um 0,51°C höher als der Mitteltwert im 20. Jahrhundert. Die wärmsten durschnittlichen Landtemperaturen wurden bisher im Jahr 2003 gemessen.
Weitere Erklärungen der NOAA in englischer Sprache:
 El Niño persisted across the equatorial Pacific Ocean during July 2009. Related sea-surface temperature (SST) anomalies increased for the sixth consecutive month. El Niño persisted across the equatorial Pacific Ocean during July 2009. Related sea-surface temperature (SST) anomalies increased for the sixth consecutive month.
Large portions of many continents had substantially warmer-than-average temperatures during July 2009. The greatest departures from the long-term average were evident in Europe, northern Africa, and much of western North America. Broadly, across these regions, temperatures were about 4-7 degrees F (2-4 degrees C) above average.
Cooler-than-average conditions prevailed across southern South America, central Canada, the eastern United States, and parts of western and eastern Asia. The most notably cool conditions occurred across the eastern U.S., central Canada, and southern South America where region-wide temperatures were nearly 4-7 degrees F (2-4 degrees C) below average.
Arctic sea ice covered an average of 3.4 million square miles during July. This is 12.7 percent below the 1979-2000 average extent and the third lowest July sea ice extent on record, behind 2007 and 2006.Antarctic sea ice extent in July was 1.5 percent above the 1979-2000 average. July Arctic sea ice extent has decreased by 6.1 percent per decade since 1979, while July Antarctic sea ice extent has increased by 0.8 percent per decade over the same period.
NOAA understands and predicts changes in the Earth's environment, from the depths of the oceans to surface of the sun, and conserves and manages our coastal and marine resources.
The world's ocean surface temperature was the warmest for any August on record, and the warmest on record averaged for any June-August (Northern Hemisphere summer/Southern Hemisphere winter) season according to NOAA's National Climatic Data Center in Asheville, N.C. The preliminary analysis is based on records dating back to 1880.
NCDC scientists also reported that the combined average global land and ocean surface temperature for August was second warmest on record, behind 1998. For the June-August 2009 season, the combined global land and ocean surface temperature was third warmest on record.
Global Highlights Summer
The June-August worldwide ocean surface temperature was also the warmest on record at 62.5 degrees F, 1.04 degrees F above the 20th century average of 61.5 degrees F.
The combined global land and ocean average surface temperature for the June-August season was 61.2 degrees F, which is the third warmest on record and 1.06 degrees F above the 20th century average of 60.1 degrees F.
Global Highlights August
The worldwide ocean surface temperature of 62.4 degrees F was the warmest on record for any August, and 1.03 degrees F above the 20th century average of 61.4 degrees F.
Separately, the global land surface temperature of 58.2 degrees F was 1.33 degrees F above the 20th century average of 56.9 degrees F, and ranked as the fourth warmest August on record.
Large portions of the world's land mass observed warmer-than-average temperatures in August. The warmest departures occurred across Australia, Europe, parts of the Middle East, northwestern Africa, and southern South America. Both Australia and New Zealand had their warmest August since their records began.
The Southern Hemisphere average temperatures for land and ocean surface combined were the warmest on record for August.
|
| Quelle: NOAA, September 2009 |
nach
oben
nach
oben
| Links |
|
 |
|
Externe Links |
|

